


Markouts for LP Profitability
Another way to measure the same thing

I provided several ways last week, and in this post, I want to show how those methods compare with the popular markout method. I will lead with summary stats for several prominent AMMS. It helps to know what we are targeting.
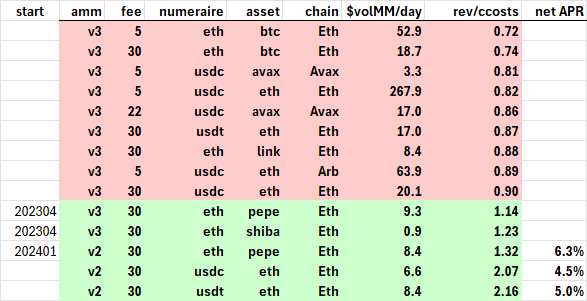
Profitability for 14 Pools
The profitability of larger pools has been pretty stable since 2022, so these data are good reflections of their current performance. Revenue is from fees, while ccosts are "convexity costs" aka LVR/IL/theta. If revenues are less than this cost, the ratio is less than 1.0, and LPs are losing money providing liquidity.
Jan 1 2023 – Aug 17 2023
TL;DR
Markouts are like cashflow pnl, and both imply a convexity cost (LVR)
Cashflow pnl easiest: no need for joining swap data with down-sampled price data
An additional pnl metric uses different data, allowing for greater efficiency
All metrics benefit from excluding trades with extreme (10x+) liquidity
It’s common (eg, here) to read that 49.5% of automated market maker (AMM) liquidity providers (LPs) lose money and that, on average, impermanent loss (IL) is 130% greater than fees. This is like saying 90% of option sellers make money, but on average, implied volatilities are 5% lower than actual volatilities. Probabilities are misleading when evaluating investments because it's the expected value that matters, not ‘the probability of a profit.’ The numbers come from a 2021 paper by Topaze-Blue/Bancor. The other most common LP performance studies are a Medium post by @0xbifemboy, and X threads by @0xshitTrader, and @thiccythot. These monikers suggest a youthful disposition, and it shows in their work, which is incomplete and discursive. Yet, these posts are often referenced by academics because they are basically all we have for v3 LP profitability net of impermanent loss. The crypto community's ignorance of LP profitability is highlighted by the absence of net LP returns on the web, especially for v3 pools.
Just as an investor cannot make an informed evaluation without understanding the basic accounting—income statements and balance sheets—LPs cannot make good decisions without an impermanent loss estimation. If one excludes this cost, the annual percentage rate return, based only on fee revenue, would be like evaluating a company based only on sales revenue.
A liquidity provider (LP) for an automated market maker (AMM) has a position with negative convexity (aka gamma), like a short option. The cost of this position is real and has been studied for 50 years since Black-Scholes was published in 1973. Understanding its essence, and that while it can be hedged this will not affect its mean, is tricky. Nonetheless, measuring this convexity cost is not rocket science, just algebra.
Markouts
A common way to measure LP net profitability, including convexity costs, is via markouts. This is when you take a pool's trades at their all-in price (including fee) and then take its profit using a price over a constant horizon, such as 5 minutes, 4 hours, or 1 month. This generates the LP's pnl,
Markout pnl = QuantityAssetTradedByPool * (future price – tradeprice)
Liquid crypto prices are efficient; there is no significant autocorrelation on the hourly or daily horizon. This means if you know the price return from the first hour of a day, that is the best estimate of the price return over the entire day. There is some negative autocorrelation at the 5-minute or less horizon, mainly due to the bid-ask spread or fees on AMMs, so one should use a horizon of at least an hour to eliminate that noise. However, a super long markout horizon, like 7 days, generates a larger standard error and is confusing when presented, as it contains future information (like a chart of 10-year future returns where the datapoint for 2004 contains the return from 2004 to 2013).
Yet, pulling AMM swap data and joining that to downsampled Binance prices is a pain. Given efficient prices, a markout using the same end-of-day price will generate the same expected value with a lot less work. That is, this
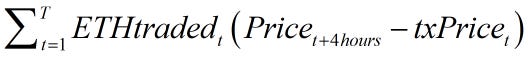
Has the same expected value as this
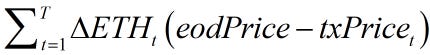
Pool swap events will contain the amount of tokens going in and out of the pool, which often includes the fee. In that case, algebra reveals a simple alternative.

Summing the pool's net token changes value over a day and then using the end-of-day price (eodP) is what I call the pool's cashflow pnl. One can use the eodP from the swap data, as this will only generate noise for trades at the last few minutes of that day, but one can also do a simple join with a dataset of centralized exchange (CEX) eodPs, as any good crypto researcher should have such data handy.

Assuming liquidity is constant for a pool over a day, this will be mathematically identical to the formula below. I will refer to this estimator as the 'square root' pnl estimate. Most AMM pools have simple fees, like 0.05% or 0.30%, so sum up the absolute value of the numeraire asset—commonly USDC or ETH—and multiply by the fee.
The cashflow and square root methods are much easier to calculate than the markout method, as they do not require joining a dataset with swap events to a dataset with downsampled price data. Further, generally, one is going to bin markout pnls into sums by day anyway, so it saves this step.
Below is a simple example with zero fees and constant liquidity. It shows how the LP pnl and convexity costs, calculated three different ways, are the same.
Example showing equivalence of markout, cashflow, and square root pnls

Empirical evidence for this equivalence is demonstrated by calculating markout and cashflow pnls for several pools from 1/1/2024 through 6/30/2024. The Uniswap v3 pools generate end-of-transaction prices with their swap events, making it possible to calculate the instant pnl. As expected, 30 bp fee pools generate an instant profit on average. However, over only one minute, this becomes negative, highlighting the IL. The IL is stable after 1 hour and virtually identical to using the same end-of-day price for all transactions on a particular day (thus, it will be a 1-minute to 24-hour markout, depending on when the trade occurred).
Uniswap v2 pools do not generate an end-of-trade price in the swap event (I am lazy and do not want to pull that information separately well). One can see that, unlike the v3 pools, the v2 ETH-USDC pool generates a profit.
Average Uniswap AMM profit in basis points
From January 1 2024 through June 30 2024

They are almost identical when comparing the end-of-day markout pnls to the cashflow pnl. Below, I added several decimal points just to make it clear I did not simply re-use the same data. The point is these LP pnl estimates capture the same thing, but the cashflow estimate is easier to calculate.
LP pnl per trade in basis points
data from Jan-June 2024

Adjustments
Aggregate LP statistics are noisy because pool liquidity varies over a day. This is not a significant problem for full-range v2 pools, but for v3 pools, liquidity can fluctuate by 50% from one price bucket to the next. There isn't much one can do for these, as any rule to remove one bias introduces another. For example, assuming every LP hedges when active pool liquidity changes, you will capture micro-movements subject to negative autocorrelation, like calculating volatility based on the bid-ask bounce.
While the errors generated by liquidity fluctuations wash out over time via the Law of Large Numbers, there are some notable exceptions. v3 pools experience large liquidity fluctuations from just-in-time liquidity provision. This is when bots see a large transaction and try to capture the fees by adding and removing liquidity around the trade in a single block. For example, here is a single trade for 90 ETH where liquidity rose 100-fold.
PEPE-ETH pool, August 24, 2023

In this example, the liquidity provider (sniper) effectively took all the 90 ETH for 20.8e9 Pepe, getting all the fees. The trade did not affect the price, and it happened within a block. Thus, the fees and IL from this trade should be excluded from calculating LP profitability because the existing LPs were insulated from its effects.
For many v3 pools, these trades happen a dozen or so times a day, such as this record of PEPE-ETH on May 31, 2023. The total net ETH to the pool was -29 that day, but the 13 JIT trades were +310 ETH. While the effect of JIT on LP pnl is unbiased—the subsequent price could go up or down—it does increase the standard error. A simple rule to eliminate these trades applies to markout and cashflow pnl estimates (e.g., delete tx if liq>10*medianLiquidity).

The square-root pnl requires a liquidity estimate, and these 100-fold liquidity increases bias upward the liquidity estimate for that day, like taking the mean household wealth for whatever city Bill Gates is visiting. The large liquidity spikes are targeted at large trades and do not imply anything about 'real' LPs. This is why, at a minimum, one should use the median rather than mean liquidity for a v3 pool. However, it is still better to eliminate large liquidity transactions and take the mean liquidity from the remainder.
Not all liquidity shenanigans are as surgically precise as JIT liquidity. For example, on January 10, 2024, someone posted liquidity 17 times greater than the pool for 15 minutes. In this period, the price increased slightly from 19.22 to 19.24, and 'the pool' acquired 8k ETH and lost 426 BTC. However, this was really a trade by the mysterious liquidity provider, effectively posting a passive limit order. Once he pulled his liquidity, or the price breached his range, it did not return when the price retraced its earlier rise.

The net inflow of 8k ETH to the liquidity sniper did not impact regular LPs. If one left these trades in, the LP would look like they made a huge profit of 355 ETH that day due to selling lots of BTC at a high price. Without those trades, LPs lost 147 ETH, which makes more sense because the price moved a significant 8% that day, and IL is proportional to the price change.
For the square-root pnl, the average liquidity over the day was 213k, which, combined with the total ETH traded, implied a loss of 1284 ETH. Thus, the bias here would be to understate the pnl. With the adjustment, the pnl estimate is -280 ETH. Thus, removing extreme liquidity transactions generates more efficient estimators of both cashflow and square root pnl estimates.
The effect of a 10x liquidity exclusion rule is shown below. Eliminating these large liquidity trades removes noise. This can be seen in how the two independent estimates of convexity costs become more similar when we exclude them. It is not huge, as these games are not prominent in many pools. However, it makes sense and is easy to do. Another thing to notice is that they reduce the square root convexity costs estimates, as these irrelevant high liquidity observations are eliminated from daily liquidity estimates.
Average Daily Convexity Cost Estimates
Uniswap Pools on Ethereum Mainnet
Jan 2024 – August 17 2024

An Efficient IL Estimator
The cashflow pl and markout pnl, using the end-of-day price as the future price, use the same data, making the markout pnl redundant. The square root pnl, however, uses different data: it ignores pool net token changes but adds the initial price (prior end-of-day price) and pool liquidity. This allows us a more efficient convexity cost estimate, as two unbiased, imperfectly correlated estimates are better than one. If we average the daily convexity costs for pools over several months, they are 99.9% correlated.

We can also take advantage of the fact that convexity costs are never negative (not to be confusing, but while IL/convexity costs/LVR are negative, here we are talking about them as costs). The square-root method will never generate a negative number because the difference in the square root of prices is squared. However, when liquidity bounces around and pool price changes are small, we do find negative daily convexity costs backed out of the cashflow pnl. We know a negative convexity cost estimate is wrong, so we can eliminate this and just use the square-root convexity cost.
Daily Convexity Cost Estimator

APY is tricky, but revenue/cost works
While the above highlights the profit, that is only the numerator for a return on capital estimate. The capital denominator is much trickier for v3 pools, as anywhere from 20 to 80% of the total value locked is inactive, receiving neither benefits (fees) nor costs (IL). Estimating active capital for these pools is a major pain, like creating a historical replication of level 2 quotes from post, cancel, and trade data.
However, we need something, as a convexity cost of +$1 million over a year can be great or insignificant, depending on whether revenue was $10 million or capital invested was $200 million. Without a good way to get total capital for v3 pools, the best benchmark is to look at the ratio of fee revenue to convexity costs. If fee revenue is double convexity costs, that is good; if it is half convexity costs, LPs are losing lots of money.
Some Results
It's one thing to talk about IL and LP profitability, but tables and charts with summary statistics are the end game, as they allow us to see whether, say, lower latency reduces LP IL. Thus, here are some summary statistics on some prominent comparisons.
Fees
Last week, I mentioned that 30 bp pools were worse than identical 5 bp pools. Looking at this again, it seems I was wrong. I forget what I was working from, and I have since added the liquidity exclusion and averaging tactics mentioned above. In any case, the bottom line is they both lose money for LPs
Average Daily Stats for Uniswap Mainnet, 2022-Aug 2024

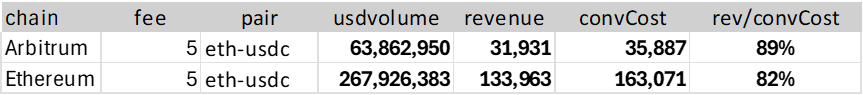
Latency
Arbitrum has a phenomenally fast 250 millisecond block time. This is phenomenally bad because it is still 249 milliseconds slower than a CEX, so there will be no price discovery for the major coins on this chain, but it implies a centralized sequencer, which is horrifying for those of us who prize Satoshi's original vision based on decentralization. Nonetheless, some people don't care about centralization risks.
Some academics came up with a theory that LP convexity costs (LVR) are proportional to the square root of block time, which is about a 7-fold difference between the Ethereum mainnet and Arbitrum. There's obviously a mistake in their theory, as we see no difference in these otherwise identical Uniswap pools
Average Daily Stats for different USDC-ETH Uniswap 5 bp pools
1/1/23 through 8/17/24
V2 vs V3
Unrestricted range pools are notoriously capital inefficient. They provide liquidity over a price range of zero to infinity, which even the most risk-averse regulator would consider excessive. However, a small denominator is not helpful if the numerator is negative. A 5% APR is pretty reasonable for a passive investment.
Average Daily Stats for Pepe-ETH, ETH- USDC, ETH-USDT
2023 – Aug 2024
