


Thorchain's Base Business was not Fine

Many have stated that Thorchain (TC) is a fundamentally sound protocol; it just extended into some poorly thought-out programs. If TC refocuses on their core business, supposedly, they are a fine dapp. For example, the usually sober-minded Eric Vorhees has long supported TC and advised everyone to calm down amidst the crisis.
Afterward, a Binance blog commenter made a common valuation point, referencing $100MM in fees. I suppose this was probably true at some point, with some lookback window, applied to TC’s definition of ‘earnings.’
Their core business has never made money for its LPs. Although their basic business case has a need, the suppliers (e.g., validators and LPs) will lose money unless the protocol is designed correctly. A viable market needs suppliers to make a profit.
TC’s LPs lost a lot of money in the January 2025 crisis when the RUNE price fell by 75%, and this would dominate the data. However, someone could say the event was an anomaly driven by a reckless decision to pause Savers and Lenders withdrawals. Therefore, I will present data for the 24 months in 2023 and 2024 to better see TC’s base profitability. I do not have access to their granular pool information before 2023, so I cannot estimate their LP gamma expense, which is essential.
TC uses a base v2-style AMM, which should give it hope, as major v2 pools usually generate a net profit for their LPs. These pools are still small relative to v3 pools, but they suggest it’s feasible for TC to generate a similar base profit. If v2 equilibrium generates 5% net APYs for their LPs, it’s reasonable to think this would happen on TC [net APY means APY including the IL/gamma expense].

Over the 2023-24 period, TC reported total earnings of $119MM or 37.5MM RUNE total earnings. USD earnings are significantly misleading because the price of RUNE varied from $1 to $11 in this period. Fees are charged in RUNE, the TC capital required for validators is in RUNE, and half of the LP’s capital is in RUNE. While the RUNE earnings are lower in magnitude, they seem impressively significant and stable.
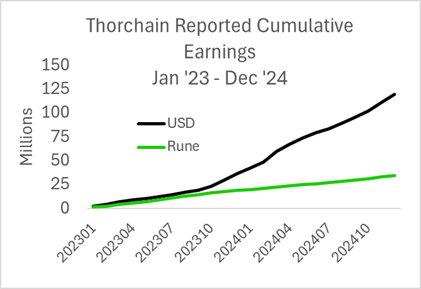
However, TC earnings include RUNE rewards, which are purely a redistribution of value from passive RUNE holders to LPs and validators, and excludes the LP’s gamma expense. Reward programs can be wise, but they generate a misleading picture of a protocol's business strength, like a government printing money to accommodate a deficit. As for excluding any metric of the LP’s IL, it should go without saying that an earnings number that excludes expenses tells one nothing about its health.
I pulled data on 19 TC pools, covering 97% of their total fee revenue. I extracted fee revenue and estimated the LP's gamma expense. I used two approaches to measure gamma expense [see Appendix: Estimating AMM PnL and Gamma Expense1]. This is helpful because their discrepancies can highlight data errors as they use different raw data. I calculated the IL using the net Pool token changes and the end-of-day price in the bottom-up approach. This is like assuming the LPs hedge their pool positions daily.

For the 24 months from January 2023 through 2024, the top-down net PnL is 3.05MM RUNE, and the bottom-up is -2.6MM RUNE. This ignores any payments to Savers and Lenders, etc. I am just trying to estimate the profitability of their basic service, cross-chain swaps.
These two profit estimates reflect 12.8MM RUNE revenue from fees and a gamma expense ranging from 15.5MM to 9.75MM Rune.

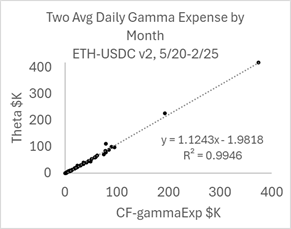
The 60% difference in gamma estimates is larger than any I have calculated on other pools, especially the v2 pools where liquidity is relatively stable intraday. Most of the difference comes from pre-August 2014, when their arbs often paid 2 basis point fees by breaking up their trades.2 In contrast, the two monthly gamma expense estimates on the venerable USDC-ETH Ethereum mainnet v2 pool are within 5% of each other.
While my gamma expense estimates vary significantly (by 60%), the net takeaway is unaffected. Given TC's TVL in this period averaged 145MM RUNE, the annualized net profit rate on total locked TVL was -0.90% or 1.05% when using +3MM or -2MM Rune over these two years. As a practical matter, it's zero applied to the protocol as a whole.
In contrast, the LPs’ fundamental net APY is definitely negative, regardless of which gamma expense is correct. The LPs bear all the gamma costs and get one-half to one-third of the TC revenue. Assuming the LPs get one-half of the TC fee revenue, their net APY was between -7% and -2.6%. They are probably the largest money-losing v2-type pool (big ones usually make their LPs a profit).
If TC doubled its revenue, the LPs would generate a meager 1% return using the lowest gamma expense estimate. TC’s needs a 10x increase in trading volume to justify its current $500MM market cap, assuming a price-earnings ratio of 20. Most TC insiders are looking for much more than that, hopeful that RUNE can 10x their token price as it has in the past. This would require a 10x increase in volume to justify its current value and then a 10x in the price-earnings ratio, a double miracle. Baseless billion-dollar valuations are sufficiently familiar always to have some option value; it’s happened at least twice, at the end of 2016 and in 2020-21. There’s a chance, but it’s mainly wishful thinking.
TC does not generate LP profitability with the most generous gamma expense estimate, so its core business is not fundamentally sound. Switching its numeraire from RUNE to the dominant BTC or ETH coins would eliminate most of its LP expenses by lowering the total variance across its pools, but it would remove the foundational use case for its native token. This saddled the protocol with a highly inefficient framework. A competitor without this deficiency would have a definitive cost advantage.
Given near-zero profitability, it is understandable that an insolvency scenario would trigger a death spiral, as there is and was no more fundamental value in the TC protocol than there was for Luna.
The above motivations generate two formulas for estimating a pool's gamma expense, one top-down and the other bottom-up. As they use different inputs to estimate the same target, they are helpful for spotting errors in one's database. The equivalence of these two metrics, and their derivation, are explained further in this post.
Method #1: top-down theta
In the top-down approach, we take the liquidity, the variance for the pool's asset, and the asset price. I estimated liquidity and the square root of price for a pool daily, and then applied the variance based on the variance calculated for that month (a look ahead, but one could argue future variance is predictable).
Method #2: cashflows and end price

This formulation has two significant advantages. First, no 'liquidity' is needed, which is sometimes difficult to get (e.g., no liquidity is reported on v2 swap event logs, and neither are TraderJoe's event logs). Second, it applies equally to v2 or v3, so you don’t need to adjust your script when processing different pools. Liquidity is often highly variable over a day, making it difficult to estimate for some pools.
The above equation equals the daily IL/lvr, assuming the token changes exclude fees. On Uniswap, the event logs generate token changes that include fees. If 100.00 USDC is sent into a 30 bp fee pool, 0.30 USDC is taken off the top and set aside, and 99.70 USDC is sent to the pool. In TC, the fees are included in the outbound number. Thus, the pool token changes, priced at the end-of-day, estimate the pool's hedged pnl, not its gamma expense.
This should equal
We can estimate IL by isolating the above equation's gamma expense.
While both tokens are used to pay fees, an excellent approximation comes from taking the total USD (or numeraire) traded times the fee to get the total fee revenue
This allows us to calculate the gamma expense via the Hedged pool pnl with fees and the fee revenue.
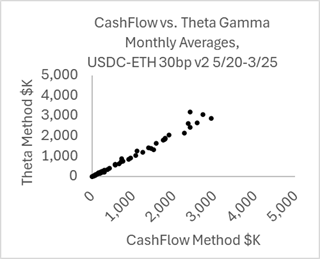
Volatility and AMM liquidity vary over time, and all estimation techniques require discrete time sample periods. This generates standard errors in both estimates. Daily estimates are convenient to calculate, and a reasonable hedging horizon generates 30 independent observations each month. The two methods produce highly correlated estimates when averaged over a month. Here are the two estimates for data on the Ethereum mainnet's ETH-USDC v2 pool. Monthly estimates of the gamma expense using the top-down theta and bottom-up cash-flow approaches generate comparable estimates.
I doubt I will reconcile the two estimates as TC has policies that do not exist in Uniswap—POL, Savers, Synths, and others. Often, one can expand daily data to uncover the issue. For example, on Oct 5, 2023, we have the following Pool Net Token changes, including fees (i.e., if a fee was paid, it was included in the net token).
RUNE BTC Start BTC-RUNE Price End price
Net Trades to Pool -938,246 47.725 13,569 13,576
The net value of the LP's passive trading can be calculated using the end-of-day price. On average, this equals the LP's IL.
-282,692 Rune = -938,246 + 47.725*13569
Cashflow Gamma Expense = Total Revenue – PnL = 23043 – 282692 = 290318 RUNE
In contrast, the top-down approach would apply the month's BTC/Rune daily variance to the theta formula, using the liquidity and price that day. The daily average BTC-RUNE price variance in October 2023 was 0.26%, corresponding to a 5% daily volatility. The actual variance that day was virtually zero, as the price changed by less than 1%.
8,282 Rune = sqrt(13576) * 108668 (liq) * 0.0026 / 4
The pool's balances were down 5% in both tokens. The net token changes from trading represented +/- 5% of the pool’s Bitcoin and Rune. A standard pro-rata LP withdrawal should move the pool token changes up and down by a constant, say to {+15%, +5%} or {0%, -10%}. I don't fully understand, but TC has many idiosyncratic pool policies.